Read the following problem and think about how a student might solve it.
There are 250 students in the fifth grade. Three-fifths of them speak two languages. How many speak two languages?
As I’ve mentioned before, I’ve been introducing tape diagrams, or bar models, to students and teachers recently as a way to solve word problems. These models have been popular in Singapore and Japan and are slowly working their way into some US programs. Essentially, the models use bars of different lengths to represent the size and relationships between different quantities.
Students who worked with tape diagrams previously solved the problem in the following way:
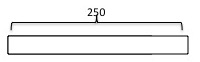
First, they drew a bar to represent the 250 students.
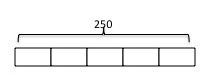
Next, they partitioned it into 5 equal parts to represent the fifths.
Then, they tried to figure out what number would go in each box. What was interesting at this stage was that students used different strategies depending on their abilities. Students who were fluent with division immediately divided 250 by 5. Students who were less comfortable with division tried to find what number times 5 would equal 250. They used guess and check until they arrived at 50. Other students used repeated addition and tried to find what number could be added five times to equal 250.
They then added the number to the diagram:
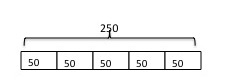
Finally they either multiplied 50 times 3 or added 50+50+50 until they arrived at the answer.
What’s neat about using this model is that students can approach the problem at different levels. Lower level students can use guess and check or repeated addition until they build up their multiplication and division skills.
Furthermore, I think it helps students make sense of the problem and the mathematical operations they are using to solve it. After enough practice drawing the models, students can be asked to visualize what they would draw in their head. This will help them to focus on what operations they are performing. It can also help them generalize about what they are doing to solve these types of problems.
Eventually, students will be able to solve the problems without drawing the models. However, starting with the models allows them to develop meaning for why they divide the set by the denominator and multiply by the numerator.
I’ll talk more about what the research says about these models next time, but I’d love to hear what your experience has been.
I love this post. Do you distinguish between “models” and “manipulatives”? It seems to me that teachers often urge kids to model situations with manipulatives at the outset, but that this is fundamentally less useful than modeling with pen and paper.
Thanks Michael. I think manipulatives are really important for younger students. However, I think after exposure with concrete materials, drawings can be used to represent the physical items. For older students, I agree with you–modeling with pen and paper is within their grasp and can be more useful. Although that may depend on the level of the student and the particular content.
Thanks Nicora. I’ve never seen these called tape diagrams or bar models before. Guess that hasn’t worked its way to my district yet.
You might be interested in seeing how I develop this idea. It was easier to do a post than try to explain it here!
http://exit10a.blogspot.com/2014/02/fraction-of-problems.html
Pingback: Using Tape Diagrams to Solve Division Problems | Bridging The Gap